scattering and stats
andrew.mccluskey at bristol dot ac dot uk
navigating physics, chemistry, mathematics, and scientific computing
Likelihood sampling analogue of ordinary least squares
from: 2023-01-17 | Updated: 2023-01-22I have recently been working on a variety of linear least squares-like problems. This led me to the following question:
How can I compare results from likelihood sampling and ordinary least squares?
The examples of linear modelling for independent and identically distributed data, seemed to use an additional modelling parameter as the data variance; i.e. this example from the PyMC documentation. However, as I understand it, for ordinary least squares, there is no additional “fitting” parameter1, so how can we make something comparable?
Let’s start by generating some data that we will try to model with our straight line.
Here, we will use the np.random.default_rng to ensure reproducibility and give the true values of the gradient and intercept as 2.513 and 0.124, respectively.
import numpy as np
rng = np.random.default_rng(42)

true_m = 2.513
true_c = 0.124

x = np.linspace(1, 10, 10)
y = (true_m * x + true_c) + rng.normal(size=10)
Now, we can quickly check that the data seems reasonable.
import matplotlib.pyplot as plt

plt.plot(x, y, '.')
plt.xlabel('x')
plt.ylabel('y')
plt.show()
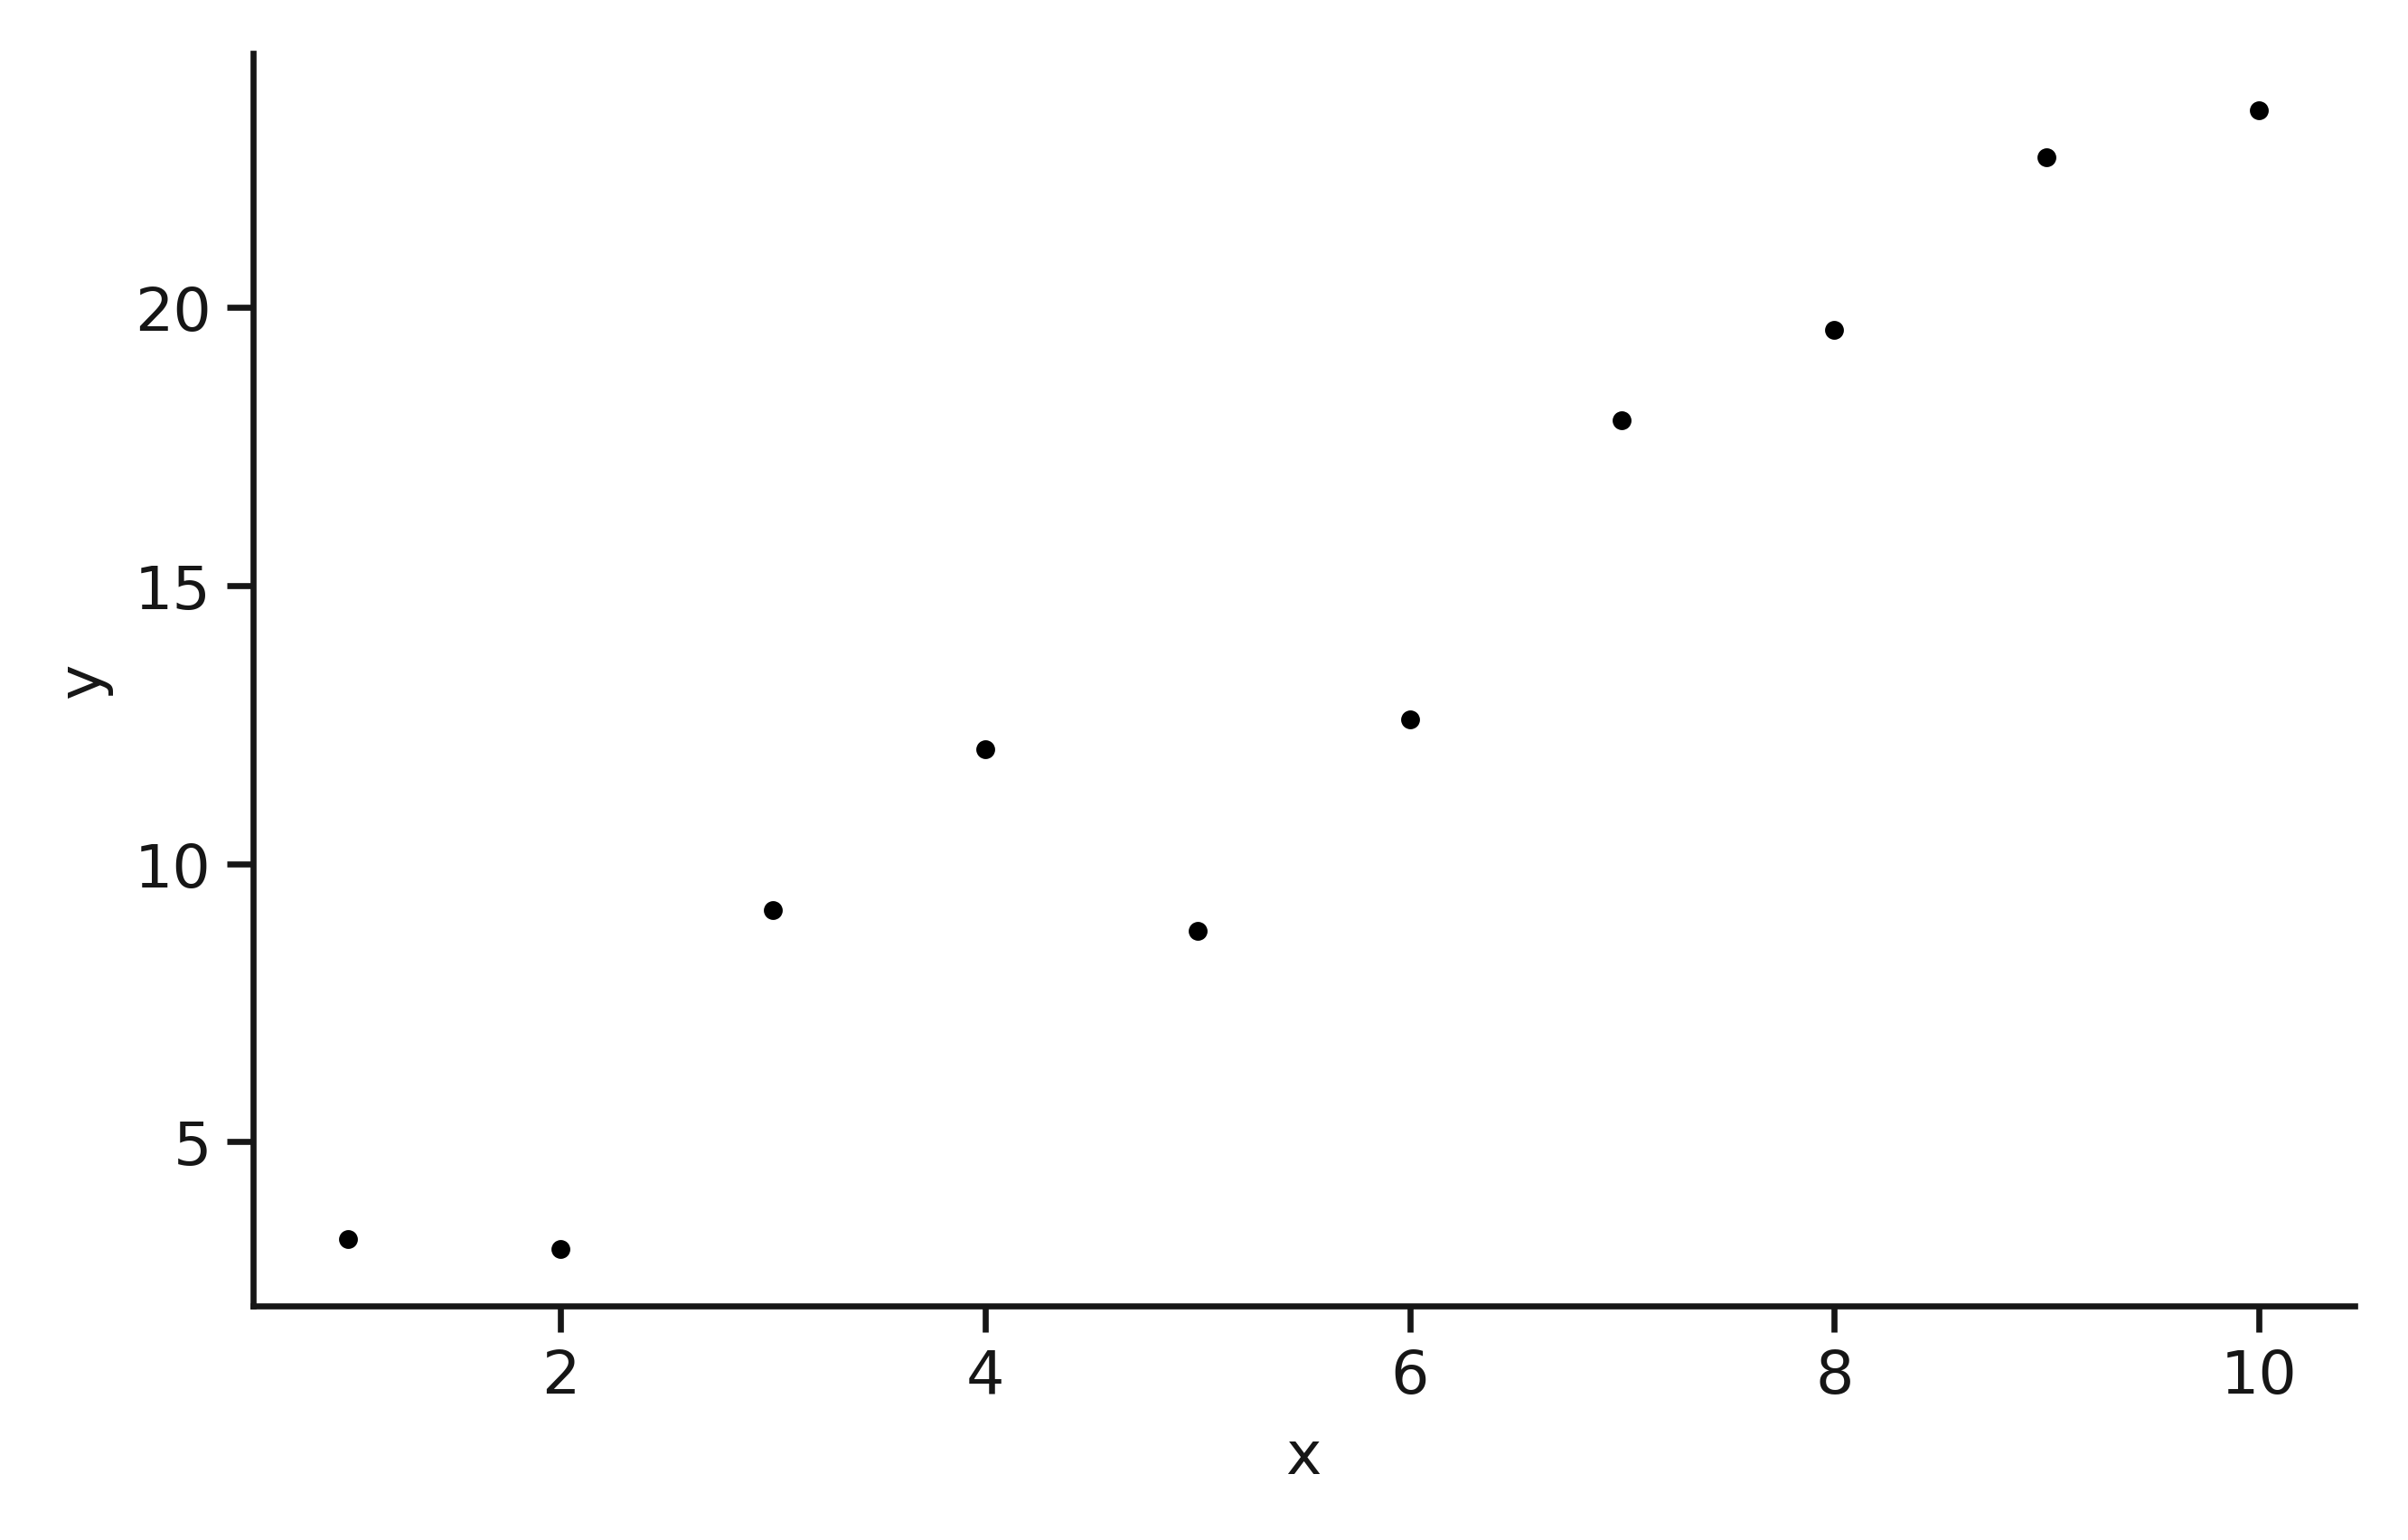
The "noisy" linear data.
The desire to perform likelihood sampling is driven by an interest in finding the variance-covariance matrix of the parameters, i.e. the gradient and intercept, \(M\).
This is possible in a purely ordinary least squares world with the following matrix manipulation,
where, \(\mathrm{X}\) is the design matrix and \(\mathrm{C}\) is an identity matrix, scaled by the variance of the residuals (the difference between the OLS line of best fit and the data).
This is what scipy.stats.linregress will do.
from scipy.stats import linregress

ols = linregress(x, y)
print(f'm = {ols.slope:.3f} +/- {ols.stderr:.3f}')
print(f'c = {ols.intercept:.3f} +/- {ols.intercept_stderr:.3f}')
m = 2.387 +/- 0.213
c = 0.145 +/- 1.324
So the question is, how do we reproduce these results with likelihood sampling?
First, we will propose the model that describes our data, \(y\), from our known measurement points, \(x\). The model should be linear with a gradient, \(m\) and an intercept, \(c\),
\[y = m x + c.\]And to be able to perform the sampling we will need a function for this model.
def model(x: np.ndarray, theta: np.ndarray) -> np.ndarray:
    """
    Defines a linear model with gradient and intercept.

    :param x: ordinate values.
    :param theta: gradient and intercept.
    :return: model values.
    """
    return x * theta[0] + theta[1]
We are interested in sampling the likelihood, so we must define it. We will assume that the residuals are normally distributed, so we can describe the model with a multi-dimensional normal distribution, the log-likelihood of which is,
\[\begin{aligned} \ln{\mathcal{L}} = -\frac{1}{2}\big[ & \ln{(|\Sigma|)} + {(m-\mu)}^{\text{T}}(\Sigma)^{-1}(m-\mu) \\ & + n\ln{(2\pi)}\big], \end{aligned}\]where, \(m\) is the model, \(\mu\) is the data, \(n\) is the number of data points and \(\Sigma\) is the covariance matrix of the data.
In many ways, this is where I got stuck. The example in the PyMC documentation here used an identity matrix scaled by the additional fitting parameter. However, to make the process analogous to OLS, we should use the variance of the residuals, \(\sigma^2(m-\mu)\), between our model and our data, as the scaling factor for an identity matrix,
\[\Sigma = \sigma^2_{(m-\mu)} I_n.\]From this, we can start to make the log-likelihood equation more efficient to calculate. Firstly, by recognising that the determinant of a diagonal matrix (including identity matrices) is the product of the diagonal,
\[|\Sigma| = |\sigma^2(m-\mu) I_n| = (\sigma^2_{(m-\mu)}) ^ n.\]Secondly, that the inverse of an identity matrix is an identity matrix, so,
\[(\Sigma)^{-1} = (\sigma^2_{(m-\mu)})^{-1}I_n.\]These small mathematical manipulations have a significant impact on the computational efficiency of the code2, which we can implement as follows.
def log_likelihood(theta: np.ndarray) -> float:
    """
    Get the log-likelihood for multivariate normal distribution.

    :param theta: gradient and intercept.
    :return: Log-likelihood value.
    """
    diff = model(x, theta) - y
    var = diff.var()
    inv = 1 / var * np.eye(y.size)
    bra = (np.log(var ** y.size) +
           np.matmul(diff.T, np.matmul(inv, diff)) +
           np.log(2 * np.pi) * y.size)
    return -0.5 * bra
With this in place, it is just a matter of finding the maximum likelihood values for the gradient and intercept.
def nll(*args) -> float:
    """
    General purpose negative log-likelihood.

    :return: Negative log-likelihood
    """
    return -log_likelihood(*args)

from scipy.optimize import minimize

max_likelihood = minimize(nll, np.array([1, 0])).x
Then using emcee3, we can sample the likelihood distributions with Markov chain Monte Carlo (MCMC).
from emcee import EnsembleSampler

pos = max_likelihood + max_likelihood * 1e-3 * rng.normal(
    size=(32, max_likelihood.size))
sampler = EnsembleSampler(*pos.shape, log_likelihood)
sampler.run_mcmc(pos, 1000 + 500, progress=True)
flatchain = sampler.get_chain(flat=True, thin=10, discard=500)
From the flatchain, we can get summary statistics for the gradient and the intercept and observe that these agree well with the results from the OLS.
print(f'm = {flatchain[:, 0].mean():.3f} +/- {flatchain[:, 0].std():.3f}')
print(f'c = {flatchain[:, 1].mean():.3f} +/- {flatchain[:, 1].std():.3f}')
m = 2.398 +/- 0.092
c = 0.236 +/- 1.448
Additionally, you can produce a plot, showing the probability distribution of the model.
credible_intervals = [[16, 84], [2.5, 97.5], [0.15, 99.85]]
alpha = [0.6, 0.4, 0.2]

distribution = (x[:, np.newaxis] *
                flatchain[:, 0] +
                flatchain[:, 1])

plt.figure(figsize=(5, 3))
plt.plot(x, y, 'k.')
for i, ci in enumerate(credible_intervals):
    plt.fill_between(x,
                     *np.percentile(distribution, ci, axis=1),
                     alpha=alpha[i],
                     color='#0173B2',
                     lw=0)
plt.xlabel('x')
plt.ylabel('y')
plt.show()
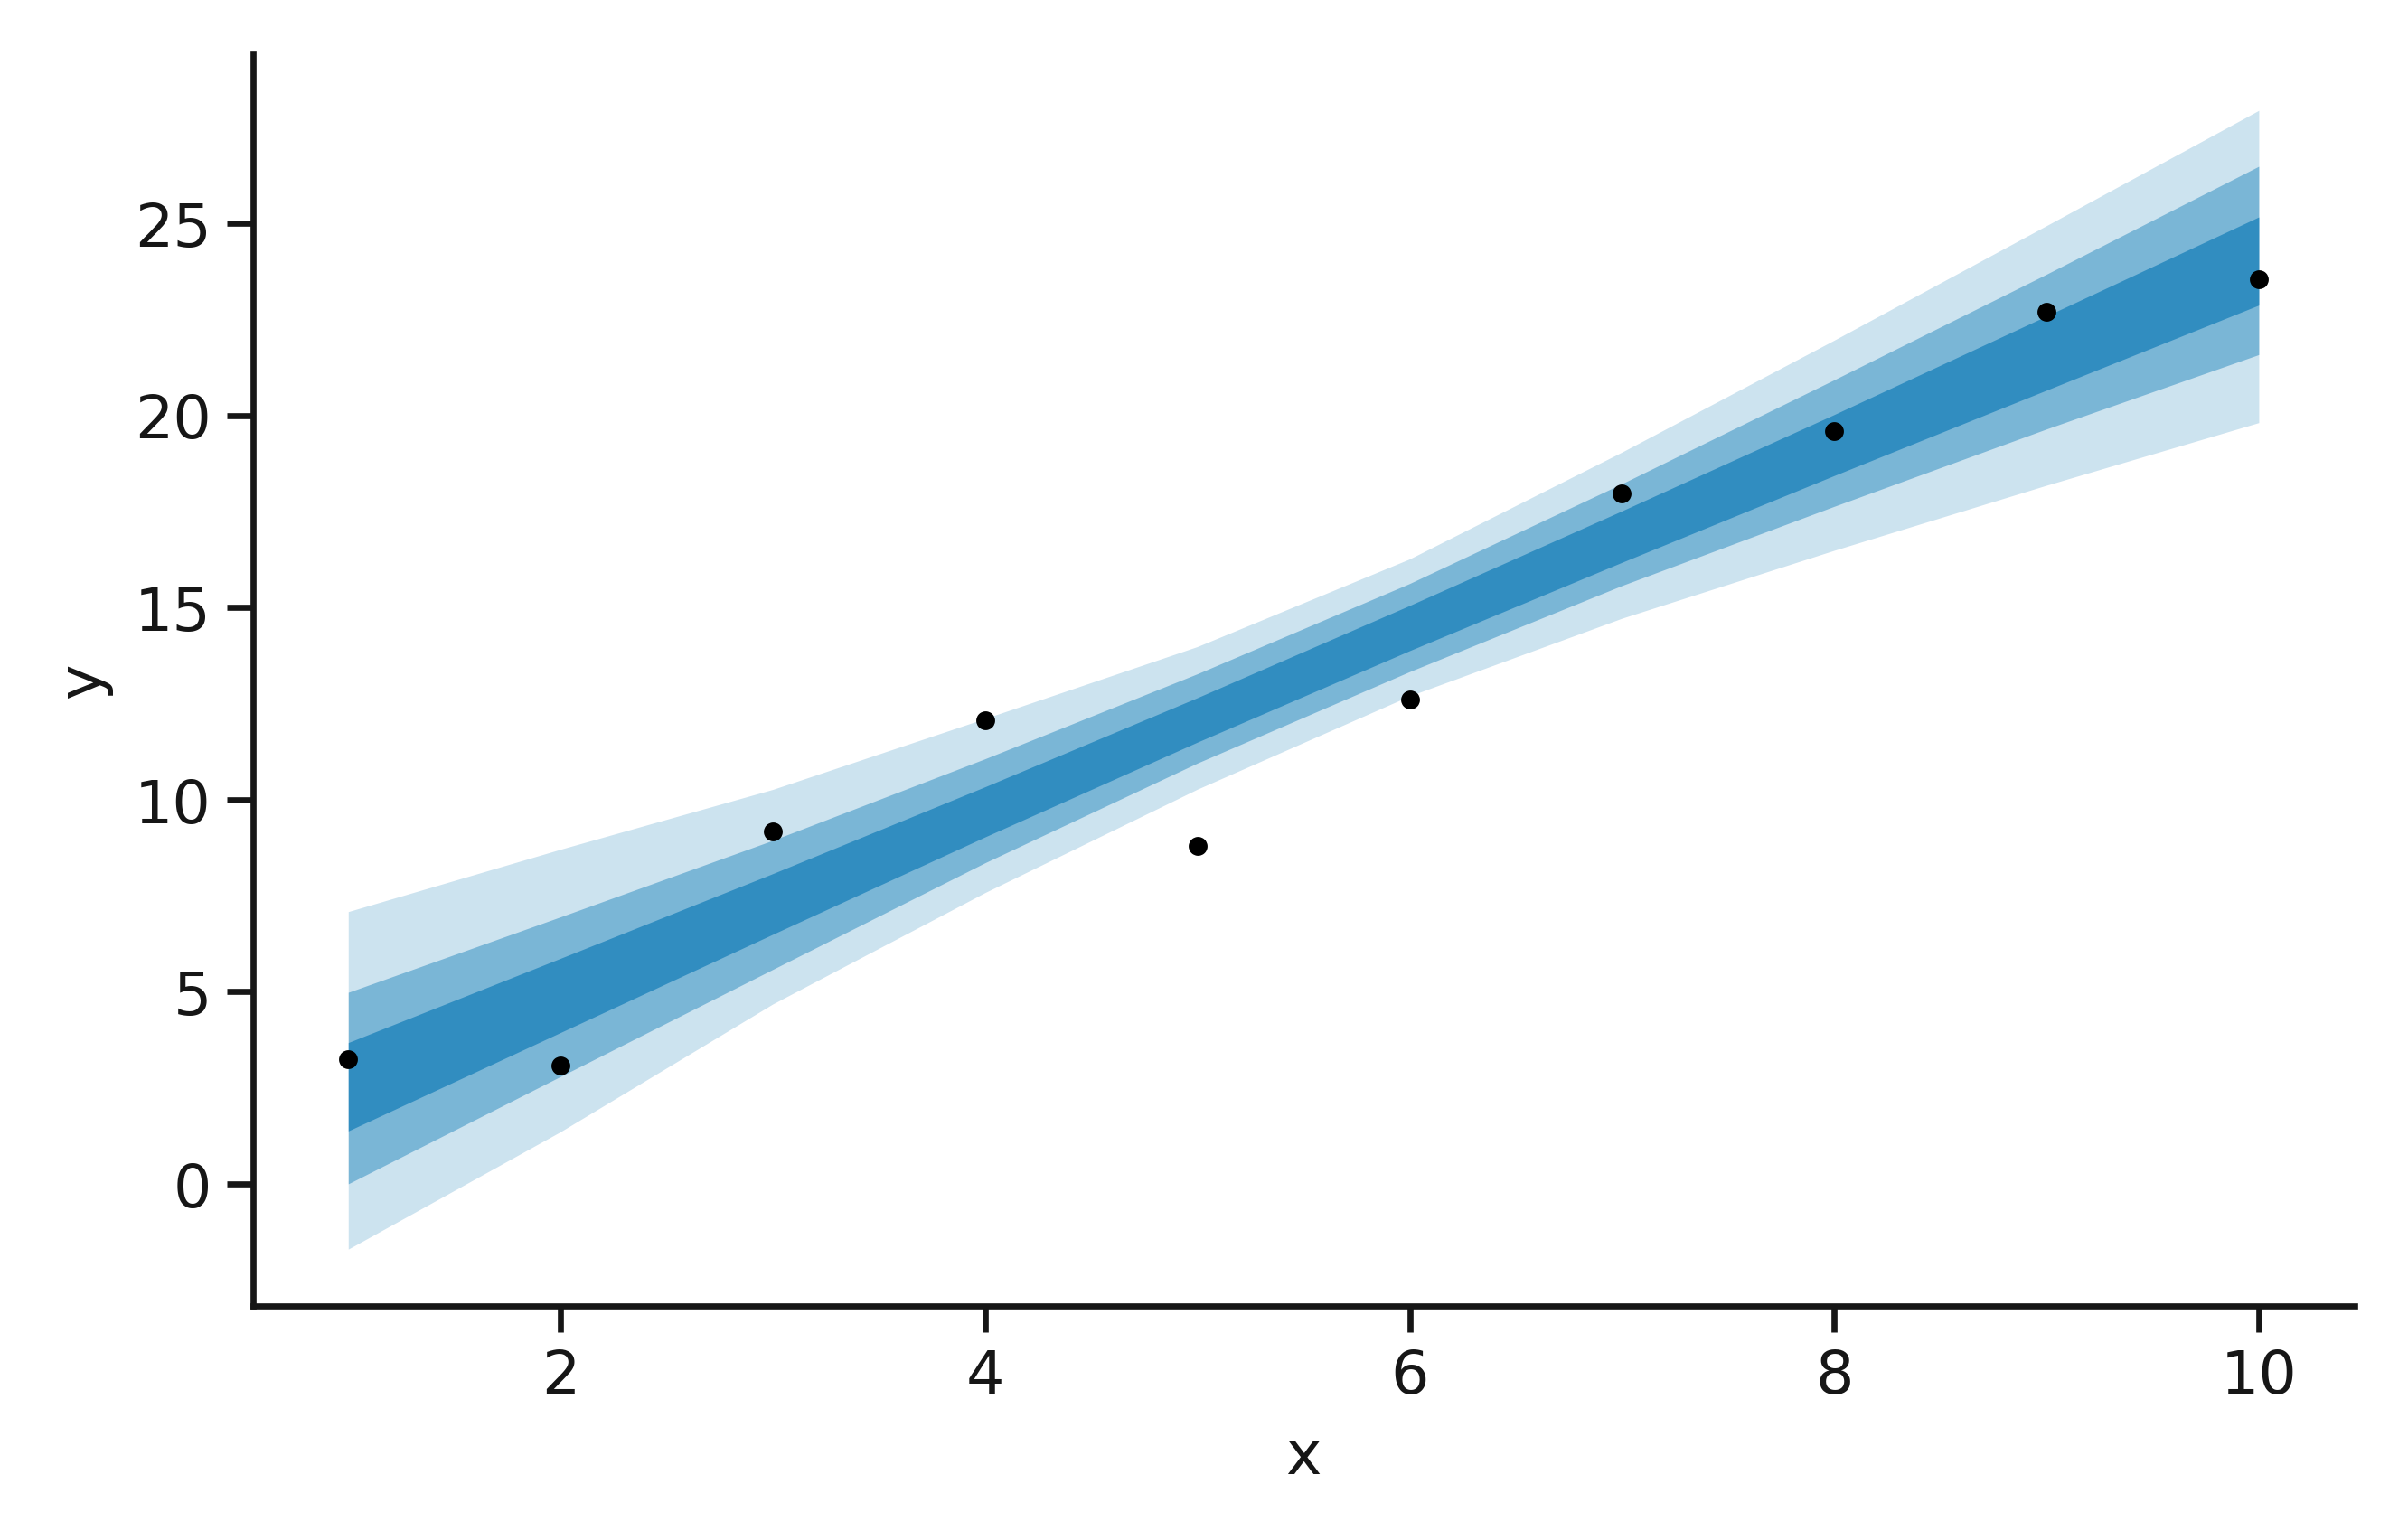
The likelihood distribution for our model, on the noisy data.
Of course, this seems a bit redundant when we can get the same answer easily from OLS.
However, the likelihood sampling approach allows this to be extended to non-linear modelling or allows a prior probability to be defined that can be used with the likelihood to investigate the posterior.